PRarena

Report Abuse

Basic Information

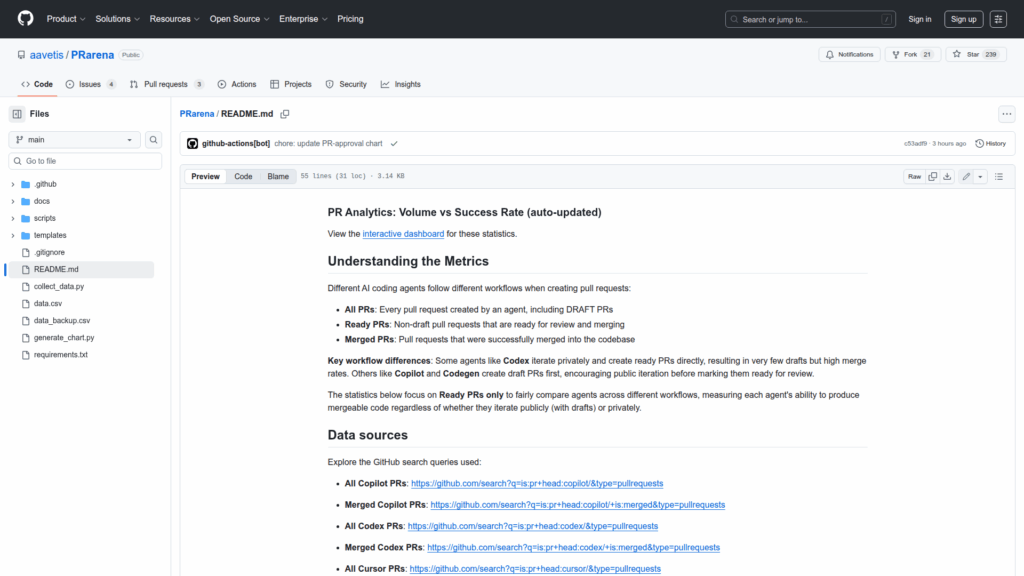
PRarena is a public analytics repository that collects and displays metrics about pull requests created by AI coding agents. It focuses on comparing the volume and success rate of Ready PRs produced by different agents such as Copilot, Codex, Cursor, Devin and Codegen. The project documents metric definitions for All PRs, Ready PRs, and Merged PRs and explains workflow differences between agents that iterate with drafts versus those that create ready PRs directly. The repository publishes an auto-updated PR approval chart and provides an interactive dashboard for exploring the statistics. Data is sourced from reproducible GitHub search queries for each agent and the repository includes a current statistics table and chart image summarizing Ready PR counts, merged counts, and computed success rates. The dataset is refreshed on a regular schedule.

Links

Categorization

App Details

Features
Auto-updated PR analytics chart that visualizes volume versus success rate for multiple AI coding agents. An interactive dashboard is available for exploring the same statistics. Clear metric definitions for All PRs, Ready PRs, and Merged PRs so comparisons are consistent. Reproducible data sources expressed as GitHub search queries for each agent, enabling verification and replication. A current statistics table showing Ready PR counts, Merged PR counts, and success rates for agents including Copilot, Codex, Cursor, Devin, and Codegen. Repository assets include a chart image and changelog commits that record updates. The repo is organized to emphasize fair comparisons by focusing analyses on Ready PRs only and highlights workflow differences between agents.
Use Cases
The repository helps researchers, engineering teams, and decision makers assess how different AI coding agents perform in real-world pull request workflows. By focusing on Ready PRs the project provides a fair measure of each agent"s ability to produce mergeable code regardless of whether agents use draft PRs for iteration. The provided statistics and charts make it easy to compare success rates and volume across agents and to spot trends over time. Reproducible GitHub search queries allow independent verification of counts and merges. The interactive dashboard and regularly updated chart support monitoring and benchmarking and can inform tool selection, process adjustments, and further study into agent behavior and effectiveness.

Please fill the required fields*